Sample Findings
The following are examples of findings that emerge from a series of tables the National Endowment for the Arts has prepared from the EEO Tables for 2006-2010. In each case the sample finding has been chosen because it reveals unique characteristics about artists in a particular state or city. Data for variables not covered by the NEA tables can be found in the original EEO Tables.
Age
Nebraska and South Dakota: Younger Artists
Approximately 56 percent of all artists in Nebraska and South Dakota are under age
40. By comparison, 45 percent of all workers in both states are under age 40. [See "All Artists" table]
Maine and South Carolina: Older Artists
In Maine and South Carolina, nearly 2 percent of all workers are 70 years of age or older. But the share of artists 70 or older working in both states is approximately 5 percent. [See "All Artists" table]
Race and Ethnicity
Oregon: Racially and Ethnically Diverse Actors Among Oregon's actors, the share who are non-Hispanic White is 60
percent--a rate well below the 80 percent of Oregon's labor force that is non-Hispanic White. [See "Actors" table]
Hawaii: Multiracial Announcers
Nationwide, only 2 percent of announcers are of two or more races. In Hawaii, however, 38 percent of announcers are multiracial. [See "Announcers" table]
Gender
Maryland, Massachusetts, Montana, and Washington: Women Architects
One-fourth
of all U.S. architects are women. Yet in Maryland, Massachusetts, Montana, and Washington, the share is roughly one-third. By contrast, in Arkansas, West Virginia, and Wyoming, nearly all architects are men. [See "Architects" table]
Disability Status
Alabama, Alaska, Kentucky, and Wisconsin: Disabled Musicians
Nearly one-quarter of the musicians working in Alaska are disabled. And the percentage of working musicians with a disability is also comparatively high in Alabama (14 percent), Kentucky (16 percent), and Wisconsin (13
percent).
Nationally, 4 percent of all artists are disabled, compared with 6 percent of the labor force. At 7 percent, the share of
dancers and musicians with a disability is somewhat higher. [See "National Disability Table, 2008-2010"]
Choice of Live and Work Place
Santa Fe, NM: Fine Artists' Residence
Fine
artists, an occupation category that includes painters, sculptors, art directors, and animators, tend to cluster in metro areas with either beautiful landscapes or pleasant temperatures.
As a share of its
metro-area labor force, the concentration of fine artists in Santa Fe is more than 7 times greater than the U.S. average. Other areas with large clusters of fine artists are Asheville, North Carolina; Boulder,
Colorado; Missoula, Montana; and Napa Valley, California. [See "Metropolitan Statistical Area Tables, 2006-2010"]
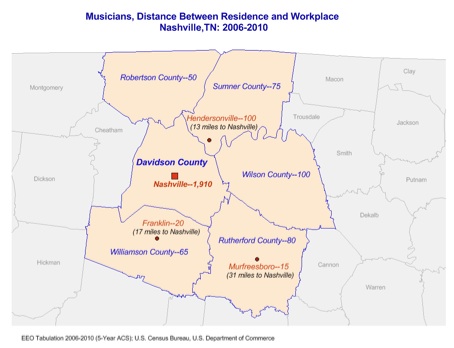
Nashville, TN: Musicians' Commuting Patterns
Roughly one-quarter of musicians working in Nashville commute to the city from outside areas. For example, an estimated 100 musicians commute 13 miles from Hendersonville (Sumner County); 20 musicians commute from Franklin, and an additional 65 musicians commute to Nashville from other parts of Williamson County.