Background
Dataset
Arts and Cultural Production Satellite Account (ACPSA) – state-level estimates.
Periodicity
Launched in 2013, the ACPSA is intended as an annual product. Complete state estimates, corresponding with the national account, became available only in 2018.
Source/Sponsor
Partnership between the NEA’s Office of Research & Analysis and the U.S. Bureau of Economic Analysis.
Research Topic
Arts economies, employment, and compensation.
Notable Features
State-level estimates of arts and cultural value-added, employment, and compensation by industry;
Location quotients (i.e., a state’s concentration of arts and cultural value-added, employment, or compensation indexed to the overall U.S. share of 1.0);
Full time-series spanning state data from 2001 to 2015.
Revisions to ACPSA
This ACPSA release is the first to provide, by industry, state-level estimates of arts and cultural value added to gross state product (GSP).
Overview
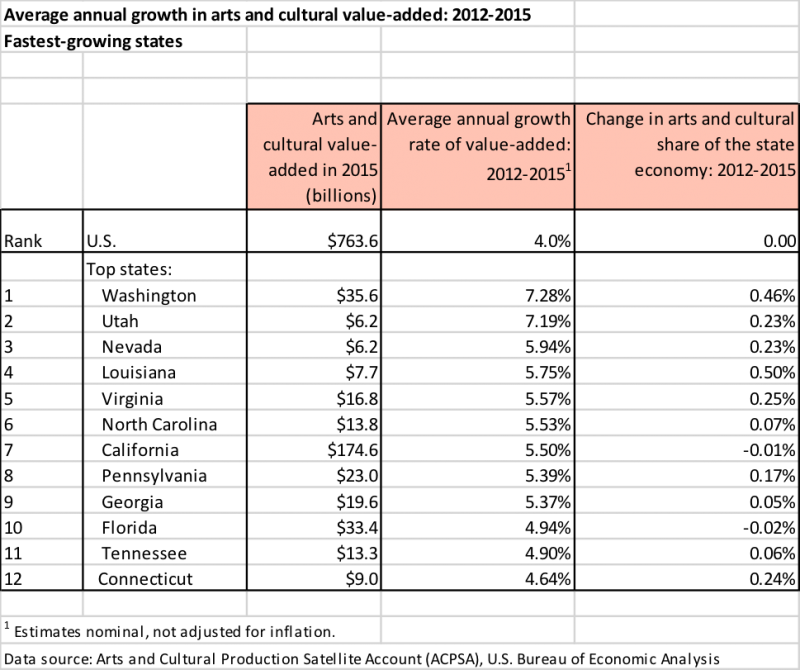
Between 2012 and 2015, the value added by arts and culture to the nation’s economy (not adjusting for inflation) grew at an average annual rate of 4.0 percent. But in 12 states, the average annual growth rate was 4.6 percent or greater.
The five states that have seen the sharpest growth in their arts economies are also states where arts and cultural production is gaining as a share of their total economies.
Washington state and Utah exhibited the fastest-growing arts economies. Between 2012 and 2015, the average annual growth rate in arts and cultural value exceeded 7 percent in each state.
Other fast-growing arts economies are found in Nevada, Louisiana, and Virginia. In all of these states, the share of arts and culture with respect to gross state product (GSP) increased by 0.2-to-0.5 percent over the three-year period.