Introduction to a Catalogue of Local Arts & Livability Indicators
By Kathryn Pettit, Senior Research Associate, Urban Institute
Note from NEA Office of Research & Analysis: This narrative introduces the Catalogue of Local Arts & Livability Indicators, which was produced by the Urban Institute for the National Endowment for the Arts, and is available as part of this NEA Arts Data Profile. The Catalogue comprises a database of tables containing a large variety of arts and livability indicators, and their relationships to specific local indicator projects such as the Boston Indicators Project and the City of Minneapolis’ sustainable indicators.
Database Structure
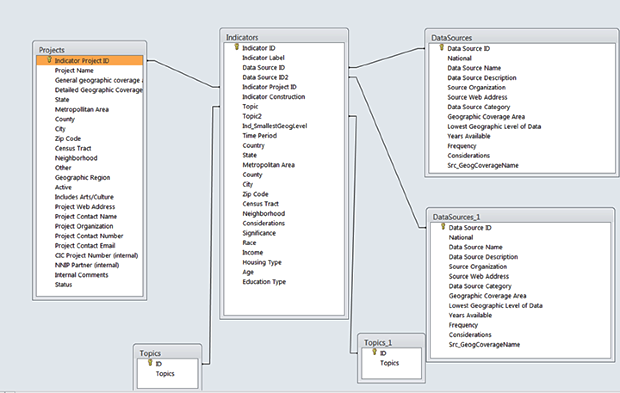
We chose to develop the catalog using Microsoft Access because a relational database would avoid duplication in data entry and storage and would offer flexibility for any next stage of development. The database contains four tables: Projects, Data Sources, Indicators, and Topics. Attachment A provides metadata for the fields in the first three tables.
The identifiers for the fields for projects, data sources, and topics are embedded in the design of the indicator database and enforce integrity, i.e. one cannot enter a data source that is not on the Data Source table. The diagram below illustrates the table relationships.
There are also four queries included in the Access database.
- Full Indicators-sources – merging of all of the fields in the indicators and data source tables
- Abbrev Indicators-sources– merging of selected fields in the indicators and data source tables
- National Data Sources – selection of the national data sources from the data source table
- Projects Cataloged – selection of projects cataloged from the project table
Project Selection
Our community indicator project review began with a list from the Community Indicators Consortium (CIC) obtained January 2013 from www.communityindicators.net/projects.
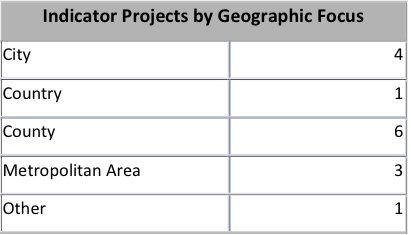
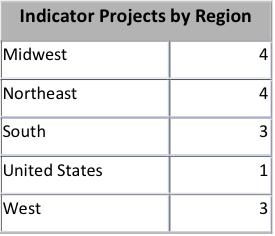
Six additional potential projects were identified during the project. Fifteen projects were selected for inclusion in the catalog based on several criteria: the inclusion of Arts and Culture indicators in their systems; diversity of region and geographic focus type; and the level of difficulty of recording the indicators and data sources.
The fifteen projects represent a mix of regions, of number of indicators in the system, and of types of geographic focus areas (see tables below).
Summary Characteristics of Projects Included in the Catalog
The catalog includes two of the pioneering indicators projects (the Boston Indicators Project and the Jacksonville Community Council Indicators) as well as more recently developed ones. Thirteen cover multiple topics; two others (Chicago Cultural Indicators and the Arts Index) focus on Arts and Culture alone. See Attachment B for a full list and comments on the cataloging process.
We would like to acknowledge Erica Raleigh from Data Driven Detroit, Liza Morehead from Portland State University, Jessica Martin from Boston Foundation, and Susan Cohn from the Jacksonville Community Council for their assistance during this project.
Indicator Entries
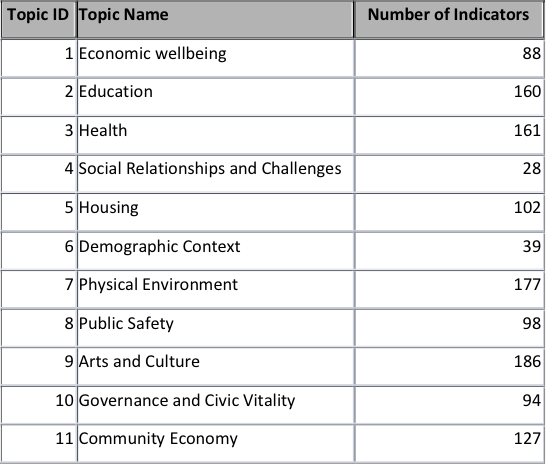
The catalog includes more than 1,200 indicators categorized by 11 topics.
Consistency Issues in Source Data
-
Indicator label: The labels used by the indicator projects have varying levels of specificity. For example, “Number of Annual Exceedances in the Level of Heavy Metals in the Pend Oreille River, Measured at Newport” vs. “Percent of streams with poor water quality” OR “Student Achievement” vs. “The percent of students tested who scored at level 3 or above-meeting or exceeding the state standard-on the Grade 3 English exam.”
-
Indicator construction: These entries also have varied content. The field was entered when we deemed necessary for indicators copied and pasted manually, but not consistently for those that were loaded in bulk. Sometimes the indicator label is very specific and no other explanation is needed.
-
Data Source and Source Organization: The project sites differed in how well and whether they distinguished between the name of a data source, such as the decennial census, and the organization that produces the data source, such as the U.S. Census Bureau. Some sources are secondhand, such as a state department of labor web.